Interactive data narrative examining the growing tension between housing affordability and public transport access across Australia's 8 capital cities from 2020 to 2025. Built for policy makers using real ABS and BITRE data.
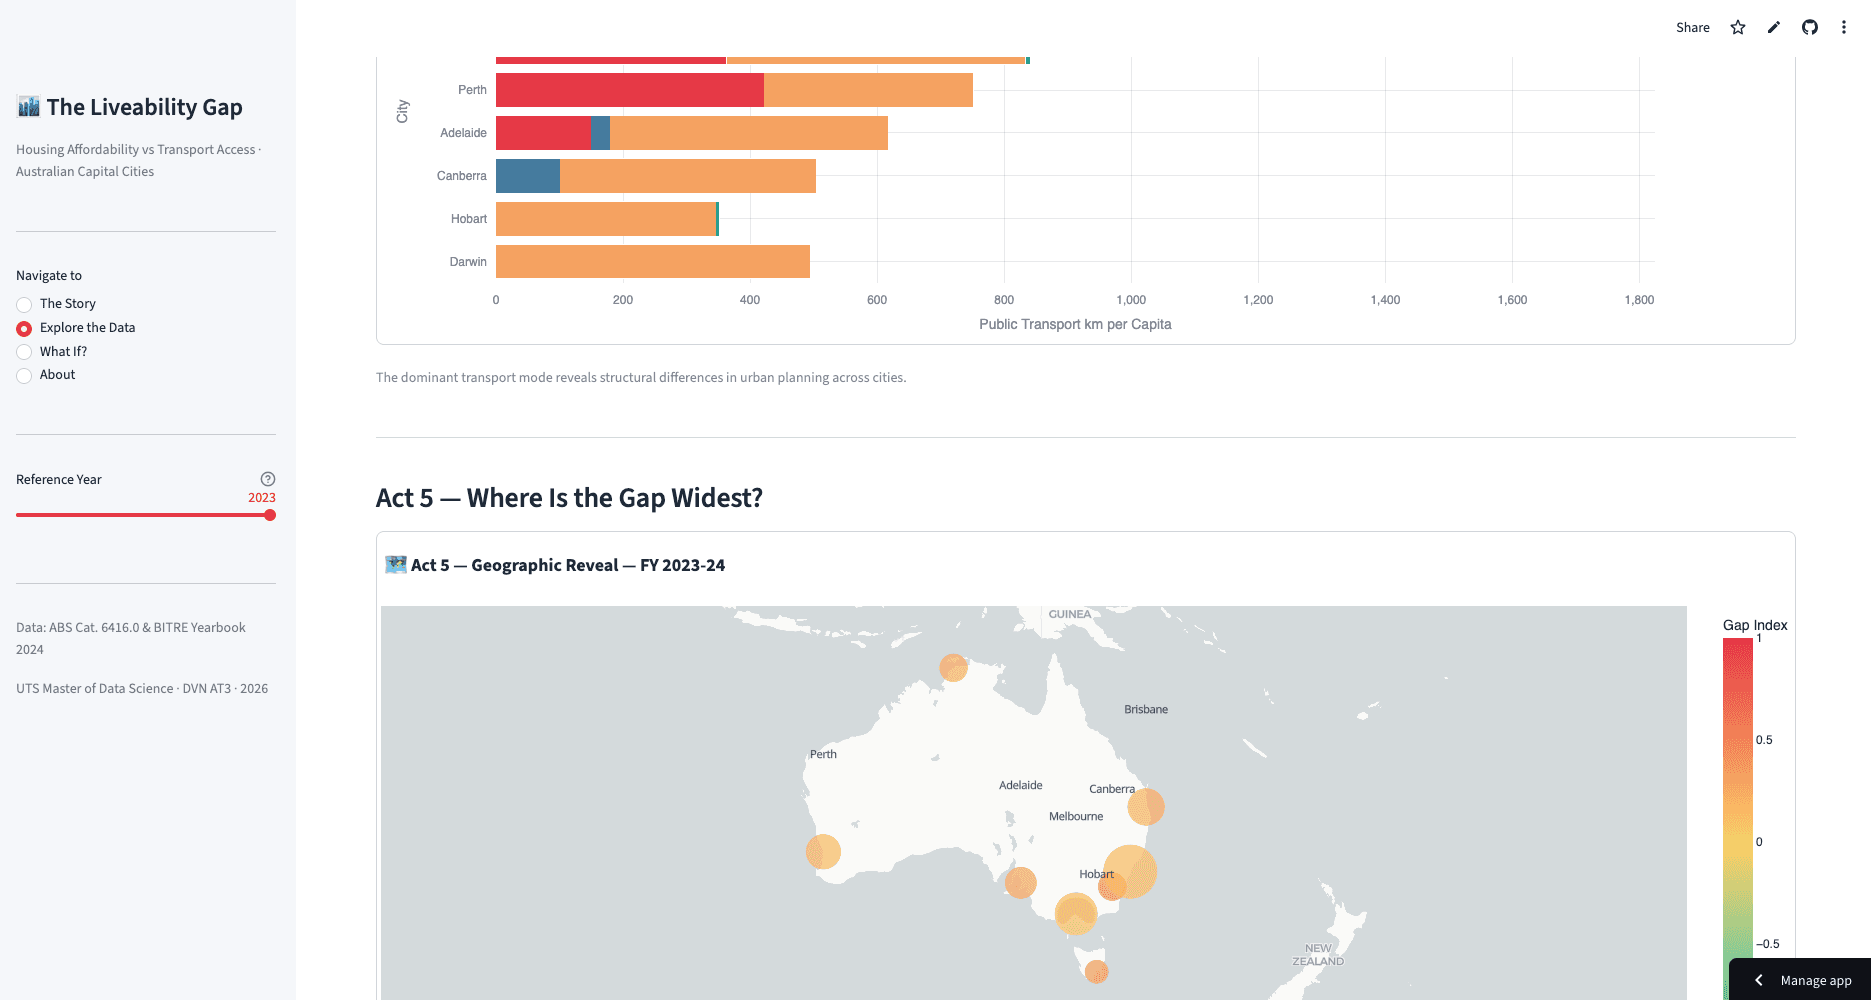
A data storytelling project built in Streamlit that explores the structural tension between housing affordability and public transport investment across Australia's eight capital cities between 2020 and 2025. The narrative is grounded in real datasets from the Australian Bureau of Statistics (ABS) and the Bureau of Infrastructure and Transport Research Economics (BITRE), processed and visualised with Pandas, Plotly, and Matplotlib. The project was designed with policy makers and urban planners as the intended audience, presenting findings as an interactive, scrollable data report rather than a static dashboard. Completed as part of the Data Visualisation subject in the Master of Data Science and Innovation at UTS.
